Topic: Linux: Audio Cracks but CPU not at 100% load

Hey,

because of User Groove On and his fabulous idea of using the TASKSET command in Linux (check https://forum.modartt.com/viewtopic.php...3#p974513) I came in contact with optimizing PTQs performance index and the audio load.

As mentioned in two of my posts, https://forum.modartt.com/viewtopic.php...26#p988126 and https://forum.modartt.com/viewtopic.php...60#p988860 I do suffer audio cracks with my desired settings of 32bit/48kHz(Stage Version)/128 Buffer Size/256 Polyphony.

Ive tried all kinds of optimization, like using a lowlatency Kernel, 1000Hz Clock Rate, PipeWire + WirePlumber as Audio Driver/Server,
the mentioned taskset limit to different CPU Cores - trying 4-6 physical and HT core combinations,
fixing the upper/lower clock speed with Intels P-State Governors of the Intel i5-82650U CPU,
and setting PTQ to Multicore Rendering MAX and disabling the CPU overload detection.


Still, I suffered audio cracks when causing a high Polyphone load,
which is why I worked around and set my Polyphony in PTQ pretty low (48) to lower the CPU usage and not suffer any audio cracks.

This workaround does the trick, but I wasnt satisfied with the solution for obvious reasons!

Because of that my best guess was that the CPU is maybe switching clock speeds to a lower value while PTQ runs and does not react quick enough when the workload goes up again, which is why I even changed from Intel P-State and its governor to the P-State passive mode which enables the use of ACPI and its governors, like userspace, to really fix the CPU clock frequency on point.

But even than, running at the max. CPU clock speed, and using 6 of 8 Kernels, PTQ always plotted me that the audio load is higher than my performance index whenever I tested setting Polyphony higher than 48. Obviously I only had a few issues with lower Polyphonys count but a lot of overload "red lines" when causing actual 256 Polyphones.

Contradictory to that, the read out values of the workload of the CPU with other tools like SysMonitor showed, that the CPU load was actually quite low: 60% usage at max. clock speed when playing a file that causes 256 Polyphony. Yet, the audio load still exceeded the performance index - which I have troubles to understand why.

A suggestion by ChatGPT was to check IRQ handles: But the workload is shared equally between the cores, so that aint the issue.

I havent tried disabling the ondemand service, or disabling other power management features yet to enforce even harder that the CPU is not changing its clock speed, but it seems unlikely to me that my idea of the CPU freq. changing is the actual cause why my performance index is max'ed out while the workload of the CPU is not.
That was the moment when I have just noticed that changing the Buffer size got alot of impact: Which makes sense, as we lower the workload again.

Previously all my tests have been performed with PTQ set to 32bit/48kHz/128 samples, because I favored the lower latency of 2.7ms.

Now I started to see, that setting a sample size of 256 allows for only occasional overloads when running actual tests with 256 Polyphones, further, setting a sample size of 512 seems to never cause an overload any longer when causing and actual load of 256 Polyphones.
Somehow thats already a nice step forward, because at least the system is capable of performing the desired Polyphones.

Yet, I am not satisfied:
I struggle to see why the performance index is "quite low" while tools to read the CPU load claim the CPU cores are not anywhere close to 90% load, most of the time its more like 60% load!

That is why I share my experience and like to ask if you had similar encounters, and have an explanation and maybe a solution for it?

Fact is, I do have audible cracks with a lower buffer size and 256 Polyphony. Fact is PTQ states the audio load (yellow graph) is higher than the performance index (blue dots).
So PTQ actually is right - but my system is telling me somehow otherwise: There should be power reserves of the CPU available for PTQ to use, but it just doesnt use it!

I know alot of factors and underlying features, on the software level, the kernel software level, the chipset level and the CPU internal level, can cause the CPU to actually throttle down, but it does not seem that is the case:
The CPU is running cool (Ive stress tested the CPU with stress-ng and reach way higher temps that come close to the max temp of 80°C than the temps that PTQ cause when running the 256 Polyphone MIDI files with a low buffer size) and the desired max. clock speed runs continuously without an issue even at 100% CPU load. I even considered that the actual possible max. clock speed for all cores is lower than advertised: While a single core can go up to 3.9GHz for this CPU, all 8 cores can not exceed 2.4GHz due to thermal/TDP/firmware management. So I base my load on the 2.4GHz, and not even the "misleading" 3.9Ghz that are displayed when using f.e. the performance governor but not causing actual workload.

My conclusion is, that the CPU is not limited (thermal limitations, clock speed limitations, ...).
Obviously, my RAM load and Disk I/O when running PTQ are far below their maximum capabilities and dont cause any bottleneck.

Further: I expect this to become worse! As soon as I could raise the sample rate to 192kHz with a different version of PTQ, the workload would increase again. But I do feel like I need to get another PTQ version to allow me for a higher sample rate, because the buffer size of 512 is equal to ~10.7ms latency which I assume is too much to have a responsive keyboard with factoring in all the other delays (MIDI Input delay, Sound output).


Which again brings me to the beginning:
Why do I suffer audio cracks when enhancing the workload, like by lowering the buffer size - it is a fact that I overload the system, but why can I not confirm this anywhere else than in PTQ as everything else states the CPU could perform more?

I dont expect PTQ to spare some potential available resources. But to the same it seems like there are more resources available by the system that are not used.


That is why I appreciate all kinds of input of you that I might should consider, check, or test.

Additionally, I like to know your Buffer Size, Sample Rate, Bit Depth, Polyphony, used CPU, CPU workload and Performance Index with info if you ever encounter overloads?

Thank you

https://abload.de/img/2023-03-25-ptq_overlokrd8i.png

Last edited by Vepece (25-03-2023 20:57)
Ubuntu 22 + Kernel lowlatency + 1000Hz + PipeWire + WirePlumber | i5-8265U + taskset Limit 4 Cores + CPUPower-GUI fixed clock freq | PTQ8Stage @ 32bit/48kHz/128Buffer/256Polyphony = Perf. Index ~60-90

Re: Linux: Audio Cracks but CPU not at 100% load

Vepece wrote:

[...]I like to know your Buffer Size, Sample Rate, Bit Depth, Polyphony, used CPU, CPU workload and Performance Index with info if you ever encounter overloads?[...]

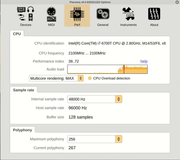
This is mine at "powersave" governor (used to have more cracling)
https://i.postimg.cc/23kMNVW2/vlcsnap-2023-03-25-15h26m20s851.png

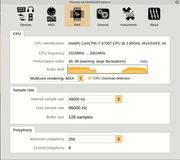
now with "performance" governator (oops... captured the image a bit to late... trust me it was up and over 256 poly),
show a lower graph level than at "powersave":
https://i.postimg.cc/9zLSmCtV/vlcsnap-2023-03-25-15h26m58s923.png

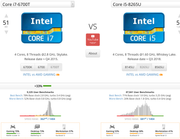
this is my cpu compared to your's (it's in the internet: must be true!)
https://i.postimg.cc/GTm5F5RZ/i58-Uvsi76-T.png

I would say you are facing the tremendous variation on performance of your CPU, maybe focus on that.
(from another thread seems that you are more knowledgeable than me, so I'm not sure how useful this is.)

Last edited by Antonio M (25-03-2023 22:46)

Re: Linux: Audio Cracks but CPU not at 100% load

Hey,

I would say you are facing the tremendous variation on performance of your CPU, maybe focus on that.

As mentioned above, my attempt to solve the audio cracks focused on exactly the idea that the CPU causes fluctuations - but its not. The userspace governor "nails" the CPU clock frequency down.

I had a really interesting expirience just now:
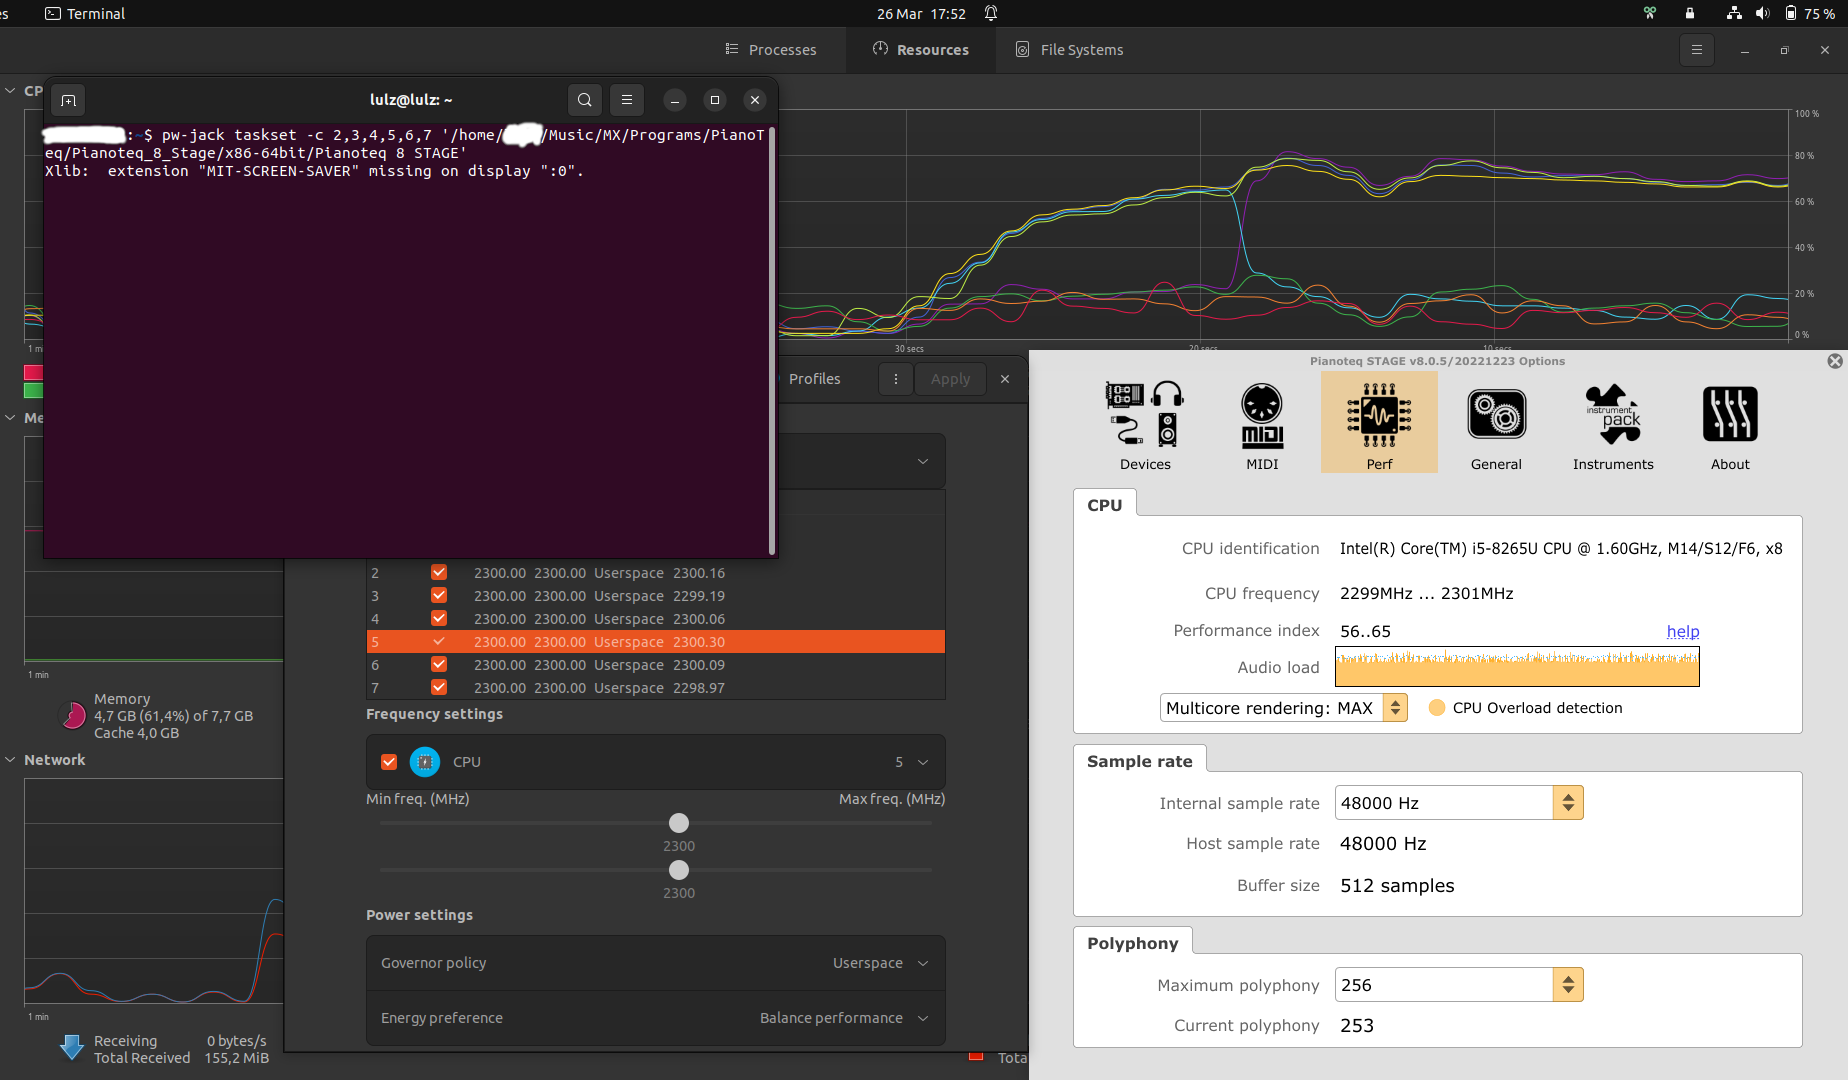
When trying again to use the TASKSET command to try different CPU cores, I noticed that PTQ will never use more than 4 cores!
I tried to use 6 cores, as previously tested already but never noticing the CPU load in SysMonitor was not shared onto 6 cores,
but no matter what: It will only use 4 cores!

Thats a HUGE downside for me, because my system could provide more computing power and therefor I would have more performance!

I will contact Modartt regarding this "issue" and report back.

https://abload.de/img/2023-03-27-ptq_tasksejidhz.png


Greetings

Last edited by Vepece (26-03-2023 23:33)
Ubuntu 22 + Kernel lowlatency + 1000Hz + PipeWire + WirePlumber | i5-8265U + taskset Limit 4 Cores + CPUPower-GUI fixed clock freq | PTQ8Stage @ 32bit/48kHz/128Buffer/256Polyphony = Perf. Index ~60-90

Re: Linux: Audio Cracks but CPU not at 100% load

Vepece wrote:

Hey,

I would say you are facing the tremendous variation on performance of your CPU, maybe focus on that.

As mentioned above, my attempt to solve the audio cracks focused on exactly the idea that the CPU causes fluctuations - but its not. The userspace governor "nails" the CPU clock frequency down.

I had a really interesting expirience just now:
When trying again to use the TASKSET command to try different CPU cores, I noticed that PTQ will never use more than 4 cores!
I tried to use 6 cores, as previously tested already but never noticing the CPU load in SysMonitor was not shared onto 6 cores,
but no matter what: It will only use 4 cores!

Thats a HUGE downside for me, because my system could provide more computing power and therefor I would have more performance!

I will contact Modartt regarding this "issue" and report back.

https://abload.de/img/2023-03-27-ptq_taskseelezs.png


Greetings

There are only 4 cores (with hyperthreading) which can help depending on the
thread. Cpu monitor gives a slowly varying average readout. Download and run the command line "atop" and you should get a better idea what threads are using the cpu. The best indicator of load is Pianoteq's "audio load" meter
which likely detects that the thread looses the cpu before completely processing the buffer. Small buffers are less efficient. Running a higher frequency (more responsive) kernel is less efficient (smaller time slice).
Increasing priority of some of the threads may help a bit.

Re: Linux: Audio Cracks but CPU not at 100% load

levinite wrote:

There are only 4 cores (with hyperthreading) which can help depending on the
thread.

Ive been considering what Intels HT actually is doing before, so you are supporting the insecure side in me with your statement.
But coming from the readouts of SysMonitor, its fact that PTQ only uses 4 threads - it could use more threads.
I can stress-ng the other 4 threads and see a difference in the graphs (<10% workload vs. 100% workload), so there are clearly threads unused that could be used for computing.
How all this translates into physical cores within Intel is a blackbox to me - but does it really concern us?

I would appreciate if you got a system with more physical cores to provide some details if your PTQ runs on more than 4cores/4 threads?

levinite wrote:

Cpu monitor gives a slowly varying average readout. Download and run the command line "atop" and you should get a better idea what threads are using the cpu.

Ive tried atop with -y setting,
and it supports my claim: Only 4 threads got a workload of (user) ~50-60%, while the other 4 "idle" and do the rest, no matter what taskset specification I use.


EDIT: When in doubt, ask ChatGPT! "She" supports your point of view:

ChatGPT 3.5 Free wrote:

I received the input by a user, that my CPU only features 4 cores and the other 4 are Hyperthreading threads. He suggests, this is the cause Pianoteq only uses 4 threads but not 6 or 8. How does Intels HT works in this case: Is one process limited to 4 threads due to the reason that there are only 4 native, physical cores?

Yes, that's correct. Hyper-threading technology allows each physical CPU core to behave as two virtual cores, which means that a quad-core CPU with hyper-threading will appear to the operating system as having eight cores. However, these virtual cores cannot match the performance of physical cores, so a process can only use up to the number of physical cores available on the CPU.

In your case, if your CPU has four physical cores and eight threads due to hyper-threading, Pianoteq can only use up to four threads, even if you assign more to it with the taskset command. So, even if you have set the taskset command to use six or eight cores, Pianoteq will still only utilize up to four physical cores.


levinite wrote:

The best indicator of load is Pianoteq's "audio load" meter ...

As you can see in the linked replys of my own (first post) I have been considering PTQs "audio load" as "true" as it correlates with the audible cracks. Yet, I dont understand "why" there is a difference in PTQs audio load and my actual CPU load. What else is the bottleneck, if not the raw CPU performance?

levinite wrote:

... which likely detects that the thread looses the cpu before completely processing the buffer.

Interesting statement - which honestly I dont understand too much. Are there some "overlapping" numbers how to determ if the thread / buffer size / kernel timer / ... do "match" each other so its not happening that a task is handed to another thread before the entire buffer size is "processed"?
Or how to understand your statement?
I mean: At least I already use taskset to only use the same CPU threads again and again, so its not like any other CPU thread is randomly picked. But I could see how the selected threads are being tasked with different "sizes" of work, like "Kernel Timer 1000hz, 1024 sample buffer size, after 1000 samples the other 24 are a new task and handed to another thread" if thats the logic that is applied here?


levinite wrote:

Small buffers are less efficient.

With 48kHz I feel "forced" to not exceed 128 as sample buffer size, due to the mentioned latency/responsive of only 2.7ms compared to 10.7ms with a 512 buffer size. What settings are you running?

levinite wrote:

Running a higher frequency (more responsive) kernel is less efficient (smaller time slice).

Well, now that I encountered only 4 threads are being used, I got a new workaround and can use 256 buffer size with 4 threads @ 3.4GHz instead of previously 2.15GHz. It is maybe less efficient, but better than 512 buffer size @ 2.15Ghz in latency, and still not causing overloads with my MIDI Testfile causing 256+ Polyphony.

EDIT: Ah, I guess you are referring for the Kernel Timer of 1000hz, right? What value do you use?


levinite wrote:

Increasing priority of some of the threads may help a bit.

I use Pipewire and therefor all my sound is running in high priorities. I even tried the typical realtime usergroup stuff in the past but dont do any longer (RT/an entire RT usergroup would cause that the system is not the highest priority, therefor, I like the newer recommendation to NOT do this any longer).

At the moment, PTQ runs at PRI -66 to -89 and nice 0 in my system, but as mentioned the sound processing is determined by Pipewire and this runs always at PRI -89 and nice -11.
Setting PTQ manually to nice -20 does not seem to have any positive effect.


Cheers

Last edited by Vepece (26-03-2023 18:56)
Ubuntu 22 + Kernel lowlatency + 1000Hz + PipeWire + WirePlumber | i5-8265U + taskset Limit 4 Cores + CPUPower-GUI fixed clock freq | PTQ8Stage @ 32bit/48kHz/128Buffer/256Polyphony = Perf. Index ~60-90

Re: Linux: Audio Cracks but CPU not at 100% load

Vepece wrote:
levinite wrote:

There are only 4 cores (with hyperthreading) which can help depending on the
thread.

Ive been considering what Intels HT actually is doing before, so you are supporting the insecure side in me with your statement.
But coming from the readouts of SysMonitor, its fact that PTQ only uses 4 threads - it could use more threads.
I can stress-ng the other 4 threads and see a difference in the graphs (<10% workload vs. 100% workload), so there are clearly threads unused that could be used for computing.
How all this translates into physical cores within Intel is a blackbox to me - but does it really concern us?

I would appreciate if you got a system with more physical cores to provide some details if your PTQ runs on more than 4cores/4 threads?

levinite wrote:

Cpu monitor gives a slowly varying average readout. Download and run the command line "atop" and you should get a better idea what threads are using the cpu.

Ive tried atop with -y setting,
and it supports my claim: Only 4 threads got a workload of (user) ~50-60%, while the other 4 "idle" and do the rest, no matter what taskset specification I use.


EDIT: When in doubt, ask ChatGPT! "She" supports your point of view:

ChatGPT 3.5 Free wrote:

I received the input by a user, that my CPU only features 4 cores and the other 4 are Hyperthreading threads. He suggests, this is the cause Pianoteq only uses 4 threads but not 6 or 8. How does Intels HT works in this case: Is one process limited to 4 threads due to the reason that there are only 4 native, physical cores?

Yes, that's correct. Hyper-threading technology allows each physical CPU core to behave as two virtual cores, which means that a quad-core CPU with hyper-threading will appear to the operating system as having eight cores. However, these virtual cores cannot match the performance of physical cores, so a process can only use up to the number of physical cores available on the CPU.

In your case, if your CPU has four physical cores and eight threads due to hyper-threading, Pianoteq can only use up to four threads, even if you assign more to it with the taskset command. So, even if you have set the taskset command to use six or eight cores, Pianoteq will still only utilize up to four physical cores.


levinite wrote:

The best indicator of load is Pianoteq's "audio load" meter ...

As you can see in the linked replys of my own (first post) I have been considering PTQs "audio load" as "true" as it correlates with the audible cracks. Yet, I dont understand "why" there is a difference in PTQs audio load and my actual CPU load. What else is the bottleneck, if not the raw CPU performance?

levinite wrote:

... which likely detects that the thread looses the cpu before completely processing the buffer.

Interesting statement - which honestly I dont understand too much. Are there some "overlapping" numbers how to determ if the thread / buffer size / kernel timer / ... do "match" each other so its not happening that a task is handed to another thread before the entire buffer size is "processed"?
Or how to understand your statement?
I mean: At least I already use taskset to only use the same CPU threads again and again, so its not like any other CPU thread is randomly picked. But I could see how the selected threads are being tasked with different "sizes" of work, like "Kernel Timer 1000hz, 1024 sample buffer size, after 1000 samples the other 24 are a new task and handed to another thread" if thats the logic that is applied here?


levinite wrote:

Small buffers are less efficient.

With 48kHz I feel "forced" to not exceed 128 as sample buffer size, due to the mentioned latency/responsive of only 2.7ms compared to 10.7ms with a 512 buffer size. What settings are you running?

levinite wrote:

Running a higher frequency (more responsive) kernel is less efficient (smaller time slice).

Well, now that I encountered only 4 threads are being used, I got a new workaround and can use 256 buffer size with 4 threads @ 3.4GHz instead of previously 2.15GHz. It is maybe less efficient, but better than 512 buffer size @ 2.15Ghz in latency, and still not causing overloads with my MIDI Testfile causing 256+ Polyphony.

EDIT: Ah, I guess you are referring for the Kernel Timer of 1000hz, right? What value do you use?


levinite wrote:

Increasing priority of some of the threads may help a bit.

I use Pipewire and therefor all my sound is running in high priorities. I even tried the typical realtime usergroup stuff in the past but dont do any longer (RT/an entire RT usergroup would cause that the system is not the highest priority, therefor, I like the newer recommendation to NOT do this any longer).

At the moment, PTQ runs at PRI -66 to -89 and nice 0 in my system, but as mentioned the sound processing is determined by Pipewire and this runs always at PRI -89 and nice -11.
Setting PTQ manually to nice -20 does not seem to have any positive effect.


Cheers

I run it on a standard pi4 but I do get the output I expect even at the default atop 10s interval. Please post your atop screenshot while you hear the overload. Maybe this will show something that was overlooked.

Re: Linux: Audio Cracks but CPU not at 100% load

levinite wrote:

I run it on a standard pi4 but I do get the output I expect even at the default atop 10s interval. Please post your atop screenshot while you hear the overload. Maybe this will show something that was overlooked.

Hey,

I tried to stress my system quite hard - running multiple other programs (Firefox, Opera, Thunderbird, Spotify),
went with Intel PState Performance Governor this time,
atop 1 -y.
and watch -n 1 sensors so you can see the CPU temps not causing any down throttling.

Occasionally I managed (while taking screenshots) to stress the system enough for like 70% CPU load, so atop marked it blue - but "thats it".

https://abload.de/img/2023-03-27-atopy1s_pshifiu.png

You see anything interesting in there?
I see that neither sys + usr cpu load combined is anything serious, yet, again, audio load is too much.

Greets

Last edited by Vepece (27-03-2023 00:47)
Ubuntu 22 + Kernel lowlatency + 1000Hz + PipeWire + WirePlumber | i5-8265U + taskset Limit 4 Cores + CPUPower-GUI fixed clock freq | PTQ8Stage @ 32bit/48kHz/128Buffer/256Polyphony = Perf. Index ~60-90

Re: Linux: Audio Cracks but CPU not at 100% load

Vepece wrote:
levinite wrote:

I run it on a standard pi4 but I do get the output I expect even at the default atop 10s interval. Please post your atop screenshot while you hear the overload. Maybe this will show something that was overlooked.

Hey,

I tried to stress my system quite hard - running multiple other programs (Firefox, Opera, Thunderbird, Spotify),
went with Intel PState Performance Governor this time,
atop 1 -y.
and watch -n 1 sensors so you can see the CPU temps not causing any down throttling.

Occasionally I managed (while taking screenshots) to stress the system enough for like 70% CPU load, so atop marked it blue - but "thats it".


You see anything interesting in there?
I see that neither sys + usr cpu load combined is anything serious, yet, again, audio load is too much.

Greets

Screenshots???  ...should be interesting...

Re: Linux: Audio Cracks but CPU not at 100% load

Vepece wrote:

[...]
I tried to stress my system quite hard - running multiple other programs (Firefox, Opera, Thunderbird, Spotify)
[...]

I find "stress" useful for these tests:

$ stress -c 1
stress: info: [2599123] dispatching hogs: 1 cpu, 0 io, 0 vm, 0 hdd

$ stress -c 4
stress: info: [2602325] dispatching hogs: 4 cpu, 0 io, 0 vm, 0 hdd

Re: Linux: Audio Cracks but CPU not at 100% load

Vepece wrote:
levinite wrote:

I run it on a standard pi4 but I do get the output I expect even at the default atop 10s interval. Please post your atop screenshot while you hear the overload. Maybe this will show something that was overlooked.

Hey,

I tried to stress my system quite hard - running multiple other programs (Firefox, Opera, Thunderbird, Spotify),
went with Intel PState Performance Governor this time,
atop 1 -y.
and watch -n 1 sensors so you can see the CPU temps not causing any down throttling.

Occasionally I managed (while taking screenshots) to stress the system enough for like 70% CPU load, so atop marked it blue - but "thats it".

https://abload.de/img/2023-03-27-atopy1s_pshifiu.png

You see anything interesting in there?
I see that neither sys + usr cpu load combined is anything serious, yet, again, audio load is too much.

Greets

I have an idea but it would be more useful to show screenshots of atop with only the Pianoteq load.

Re: Linux: Audio Cracks but CPU not at 100% load

Antonio M wrote:
Vepece wrote:

[...]
I tried to stress my system quite hard - running multiple other programs (Firefox, Opera, Thunderbird, Spotify)
[...]

I find "stress" useful for these tests:

$ stress -c 1
stress: info: [2599123] dispatching hogs: 1 cpu, 0 io, 0 vm, 0 hdd

$ stress -c 4
stress: info: [2602325] dispatching hogs: 4 cpu, 0 io, 0 vm, 0 hdd

I use stress-ng for CPU load, as I mentioned above But thanks for your input!

levinite wrote:

I have an idea but it would be more useful to show screenshots of atop with only the Pianoteq load.

The Screenshot above actually is with only PTQ running.
A screenshot with other programs running would be the following.

https://abload.de/img/screenshotfrom2023-03k6dhb.png
https://abload.de/img/screenshotfrom2023-03yae3b.png


The Screenshots have been separated by not even 1 second. I took several Screenshots in a row because I noticed that this triggers overloads easily (which is odd, because by taskset I use later cores/threads. In this test I used 2 physical cores and their corresponding HT threads, so Core "3 and 4" (name is 2 and 3, as it starts with Core 0) and HT thread "7 and 8" (name 6 and 7). But dont nail me on that, I tried other combinations as well like Core 5, 6, 7 and 8 (4, 5, 6, 7...) skipping the first 4.

The Polyphony of just 178 in the second picture is just because it dropped in exactly that moment - but as you can see was 256+ not even one second earlier.

Greets

Ubuntu 22 + Kernel lowlatency + 1000Hz + PipeWire + WirePlumber | i5-8265U + taskset Limit 4 Cores + CPUPower-GUI fixed clock freq | PTQ8Stage @ 32bit/48kHz/128Buffer/256Polyphony = Perf. Index ~60-90

Re: Linux: Audio Cracks but CPU not at 100% load

Vepece wrote:
Antonio M wrote:
Vepece wrote:

[...]
I tried to stress my system quite hard - running multiple other programs (Firefox, Opera, Thunderbird, Spotify)
[...]

I find "stress" useful for these tests:

$ stress -c 1
stress: info: [2599123] dispatching hogs: 1 cpu, 0 io, 0 vm, 0 hdd

$ stress -c 4
stress: info: [2602325] dispatching hogs: 4 cpu, 0 io, 0 vm, 0 hdd

I use stress-ng for CPU load, as I mentioned above But thanks for your input!

levinite wrote:

I have an idea but it would be more useful to show screenshots of atop with only the Pianoteq load.

The Screenshot above actually is with only PTQ running.
A screenshot with other programs running would be the following.

https://abload.de/img/screenshotfrom2023-03k6dhb.png
https://abload.de/img/screenshotfrom2023-03yae3b.png


The Screenshots have been separated by not even 1 second. I took several Screenshots in a row because I noticed that this triggers overloads easily (which is odd, because by taskset I use later cores/threads. In this test I used 2 physical cores and their corresponding HT threads, so Core "3 and 4" (name is 2 and 3, as it starts with Core 0) and HT thread "7 and 8" (name 6 and 7). But dont nail me on that, I tried other combinations as well like Core 5, 6, 7 and 8 (4, 5, 6, 7...) skipping the first 4.

The Polyphony of just 178 in the second picture is just because it dropped in exactly that moment - but as you can see was 256+ not even one second earlier.

Greets

One thing I notice in the screenshots is Pianoteq identifies your cpu as a
1.6Ghz processor, but you have it running at around 3Ghz. The Pianoteq blue dots are not very level. Heating may not seem to be an issue but from what I have read the hw Intel p-state selection is done at a rate that could be faster than the timeslice. So the thermal envelope and power limit is maintained at a very fine level.  More importantly, these turbo p-state modes are not sustainable.

see * for more info

"One important property of turbo P-states is that they are not sustainable. More precisely, there is no guarantee that any CPUs will be able to stay in any of those states indefinitely, because the power distribution within the processor package may change over time or the thermal envelope it was designed for might be exceeded if a turbo P-state was used for too long.

In turn, the P-states below the turbo threshold generally are sustainable. In fact, if one of them is set by software, the processor is not expected to change it to a lower one unless in a thermal stress or a power limit violation situation (a higher P-state may still be used if it is set for another CPU in the same package at the same time, for example)."

* https://www.kernel.org/doc/html/v4.12/a...state.html

Last edited by levinite (28-03-2023 01:11)

Re: Linux: Audio Cracks but CPU not at 100% load

I stumbled upon a post, although dated, that my be of use concerning audio popping. The article is an interview with a pipewire programmer. See link below.

"Mark
I had troubles on Fedora 34 with audio popping, it turned out to be due to power management turning the intel audio hardware on and off. I was able to fix the pops with:
adding line:

options snd_hda_intel power_save=0

to file
/etc/modprobe.d/alsa-base.conf

MAY 16, 2021"

I have also found that not running Pianoteq's gui can make sometimes make a difference in cases where the cpu core speed is critical. Indeed, some of the main threads of Pianoteq simply require enough cpu time on the cores that runs these threads. So if these cores are not fast enough, it doesn't matter how many cores are available.

https://fedoramagazine.org/pipewire-the...-linux-34/

Last edited by levinite (09-04-2023 18:47)

Re: Linux: Audio Cracks but CPU not at 100% load

Since I don't have a hyperthreaded processor, I am curious...

It seems Linux lscpu can identify logical and physical cores.

"# lscpu --all --extended
CPU NODE SOCKET CORE L1d:L1i:L2:L3:L4 ONLINE MAXMHZ    MINMHZ
0   0    0      0    0:0:0:0:0        yes    3200.0000 800.0000
1   0    0      1    1:1:1:0:0        yes    3200.0000 800.0000
2   0    0      2    2:2:2:0:0        yes    3200.0000 800.0000
3   0    0      3    3:3:3:0:0        yes    3200.0000 800.0000
4   0    0      0    0:0:0:0:0        yes    3200.0000 800.0000
5   0    0      1    1:1:1:0:0        yes    3200.0000 800.0000
6   0    0      2    2:2:2:0:0        yes    3200.0000 800.0000
7   0    0      3    3:3:3:0:0        yes    3200.0000 800.0000
here logical cores 0 and 4 go to core 0"

Try taskset with 0,1,2,3 and then 0,4,1,5. You get the idea. Maybe you already tried. I suspect using 4 physical cores will increase temps so the 2nd option may work better who knows?

https://unix.stackexchange.com/question...ical-cores

Last edited by levinite (11-04-2023 02:01)

Re: Linux: Audio Cracks but CPU not at 100% load

From what I've learned with LatencyMon on Windows,

WiFi antenna and its driver are a big factor in kernel response times.

Flight mode when running audio.

Also, maybe not Google while playing.