<?xml version="1.0" encoding="utf-8"?>
<feed xmlns="http://www.w3.org/2005/Atom">
	<title type="html"><![CDATA[Modartt user forum - Feature request Chart for Archived MIDI - see how much you've played]]></title>
	<link rel="self" href="https://forum.modartt.com/extern.php?action=feed&amp;tid=8143&amp;type=atom"/>
	<updated>2021-02-01T02:09:50Z</updated>
	<generator>PunBB</generator>
	<id>https://forum.modartt.com/viewtopic.php?id=8143</id>
		<entry>
			<title type="html"><![CDATA[Re: Feature request Chart for Archived MIDI - see how much you've played]]></title>
			<link rel="alternate" href="https://forum.modartt.com/viewtopic.php?pid=973671#p973671"/>
			<content type="html"><![CDATA[<p>Actively working on it.</p><p>I just made a update in the repo <a href="https://github.com/zDEFz/PTQ-Stat">https://github.com/zDEFz/PTQ-Stat</a></p><p>To note is, that this is my first draft, it works properly for me since days, but I still make some changes.<br />As said, you can see how it looks here <a href="https://stat.def0.de/">https://stat.def0.de/</a></p><p>There is a lot to rework in the codebase, it&#039;s not yet clean and a lot of debug features are enabled.<br />It&#039;s hacked together.</p>]]></content>
			<author>
				<name><![CDATA[Defenz0r]]></name>
				<uri>https://forum.modartt.com/profile.php?id=6481</uri>
			</author>
			<updated>2021-02-01T02:09:50Z</updated>
			<id>https://forum.modartt.com/viewtopic.php?pid=973671#p973671</id>
		</entry>
		<entry>
			<title type="html"><![CDATA[Re: Feature request Chart for Archived MIDI - see how much you've played]]></title>
			<link rel="alternate" href="https://forum.modartt.com/viewtopic.php?pid=973596#p973596"/>
			<content type="html"><![CDATA[<p>-&gt; That file can then be processed to create a graph, either by uploading to a server app, or processing with some fairly simple app on your pc. </p><p>Sure, but needs much postprocessing then. Not goint todo that for each day / month. Programmatically, you have the flexibility.</p><p>I don&#039;t want to do that regularly. It just works. But I will keep polishing it a bit beforehand. You do not need a Server, but it&#039;s recommended. Even a local one does.<br />I see the progress as soon as I want. Planning to set daily goals to meet.</p><p>@dcardenosa, I used parts of your command, to reform a valid one for the needed format.</p><p><a href="https://github.com/zDEFz/PTQ-Stat/blob/main/README.md">https://github.com/zDEFz/PTQ-Stat/blob/main/README.md</a></p><p><a href="https://stat.def0.de/">https://stat.def0.de/</a><br />^ working sample.</p><p>Notes played seem pretty useless to me. Should work out the readme a bit. But it&#039;s pretty straight forward.</p><p>With that, and the code above, you can basically make it yourself.</p>]]></content>
			<author>
				<name><![CDATA[Defenz0r]]></name>
				<uri>https://forum.modartt.com/profile.php?id=6481</uri>
			</author>
			<updated>2021-01-29T20:22:17Z</updated>
			<id>https://forum.modartt.com/viewtopic.php?pid=973596#p973596</id>
		</entry>
		<entry>
			<title type="html"><![CDATA[Re: Feature request Chart for Archived MIDI - see how much you've played]]></title>
			<link rel="alternate" href="https://forum.modartt.com/viewtopic.php?pid=973595#p973595"/>
			<content type="html"><![CDATA[<p>I wonder if all this syncing and server stuff is necessary, or making things easier.</p><p>E.g., it&#039;s pretty easy to create a file containing a list with all the midi playing data:</p><p>To do this on a Windows PC, in a terminal window, just enter the command:</p><p>&gt;&nbsp; dir c:\users\[your user name]\AppData\Roaming\Modartt\Pianoteq\Archive\*.mid /s &gt; mylist.txt</p><p>This will create a file with a list of all the midi filenames (i.e., all the data), and it will have the name &#039;mylist.txt&#039;.</p><p>That file can then be processed to create a graph, either by uploading to a server app, or processing with some fairly simple app on your pc.&nbsp; </p><p>The &#039;dir&#039; command itself can be put into a simple batch file so a user can run it simply by clicking an icon on their desktop.</p>]]></content>
			<author>
				<name><![CDATA[hesitz]]></name>
				<uri>https://forum.modartt.com/profile.php?id=6474</uri>
			</author>
			<updated>2021-01-29T19:25:27Z</updated>
			<id>https://forum.modartt.com/viewtopic.php?pid=973595#p973595</id>
		</entry>
		<entry>
			<title type="html"><![CDATA[Re: Feature request Chart for Archived MIDI - see how much you've played]]></title>
			<link rel="alternate" href="https://forum.modartt.com/viewtopic.php?pid=973582#p973582"/>
			<content type="html"><![CDATA[<p>Have got something to work, with maximum effort. It auto adapts, to the existing data. So if you have recordings for more months, it will display that, as well.<br />Takes a path of your choice, gives you back for instance </p><p>[&quot;2020-12&quot;, &quot;2021-1&quot;]<br />[20.081944444444446, 19.486666666666668]<br />[241454, 212237]</p><p>The fetcher is written in Rust, will upload it later. I may give it another name, too.<br />The HTML is an adapted HighChart one.</p><p>For people who want it on the same machine, you can just pass the stdout like so: ./matcher /root/MIDI/ &gt;/root/www/stat/out.txt</p><p>I let it run all 10 minutes, like so </p><p>1. apt-get install cron <br />2. crontab -e<br />3. edit with nano<br />4. 10 * * * * /root/tool/./matcher /root/MIDI/ &gt;/root/www/stat/out.txt<br />(first argument is the input folder, then basically stdout to your folder where your HTML is in)</p><p>To note is that, I do not yet know what I should do with the monthly played notes value, to me, it is pretty useless right now.</p><p>The the HTML file I have in the directory, where out.txt is, loads the Highcharts graph, from the .txt, thats within the same folder, upon entering.</p><p>Played a bit around, and this is refreshing all 10 minutes the JSON for input -&gt; <br /><a href="https://stat.def0.de/highcharts-bar-w-sub.html">https://stat.def0.de/highcharts-bar-w-sub.html</a><br /><a href="https://stat.def0.de/highcharts-line.html">https://stat.def0.de/highcharts-line.html</a><br /><a href="https://stat.def0.de/highcharts-column.html">https://stat.def0.de/highcharts-column.html</a></p><p>Once I have everything at hand, I may should put something on github or so, with screenshots and all.</p>]]></content>
			<author>
				<name><![CDATA[Defenz0r]]></name>
				<uri>https://forum.modartt.com/profile.php?id=6481</uri>
			</author>
			<updated>2021-01-28T22:20:22Z</updated>
			<id>https://forum.modartt.com/viewtopic.php?pid=973582#p973582</id>
		</entry>
		<entry>
			<title type="html"><![CDATA[Re: Feature request Chart for Archived MIDI - see how much you've played]]></title>
			<link rel="alternate" href="https://forum.modartt.com/viewtopic.php?pid=973568#p973568"/>
			<content type="html"><![CDATA[<p>You could basically put this as HTML code, and at the point you want to use values, add them. The CSS is completely optional.<br />So you are generating a HTML file, that you can then Host on Port 80.</p><p>I&#039;m going to try today again.</p><p>You can access the local files. You are just going to overwrite the html file lets say each hour. The files either are already on the server because pianoteq runs on it or because they are synced from client to server regularly.</p><p>The sync is actually the easiest.</p><p>You would just copy the html code and append your data. Top to bottom. Or bottom to top.<br />Http-server from npm is good suited for that task of hosting either locally or on the web. On the web you would simply add nginx for https</p><p>**Edit** Working on it, think I can do it this weekend or so.</p>]]></content>
			<author>
				<name><![CDATA[Defenz0r]]></name>
				<uri>https://forum.modartt.com/profile.php?id=6481</uri>
			</author>
			<updated>2021-01-28T08:59:17Z</updated>
			<id>https://forum.modartt.com/viewtopic.php?pid=973568#p973568</id>
		</entry>
		<entry>
			<title type="html"><![CDATA[Re: Feature request Chart for Archived MIDI - see how much you've played]]></title>
			<link rel="alternate" href="https://forum.modartt.com/viewtopic.php?pid=973566#p973566"/>
			<content type="html"><![CDATA[<div class="quotebox"><cite>Defenz0r wrote:</cite><blockquote><p>You could basically put this as HTML code, and at the point you want to use values, add them. The CSS is completely optional.<br />So you are generating a HTML file, that you can then Host on Port 80.</p><p>What do you think? <br />I mean, it could run on a webserver this way.</p></blockquote></div><p>Looks good to me.&nbsp; If not running on a local server can this actually run in the browser?&nbsp; Does sandbox include ability to access the local filesystem like that?&nbsp; I didn&#039;t think it did,&nbsp; &nbsp;(but I obviously know little about web development.)</p>]]></content>
			<author>
				<name><![CDATA[hesitz]]></name>
				<uri>https://forum.modartt.com/profile.php?id=6474</uri>
			</author>
			<updated>2021-01-28T01:33:20Z</updated>
			<id>https://forum.modartt.com/viewtopic.php?pid=973566#p973566</id>
		</entry>
		<entry>
			<title type="html"><![CDATA[Re: Feature request Chart for Archived MIDI - see how much you've played]]></title>
			<link rel="alternate" href="https://forum.modartt.com/viewtopic.php?pid=973565#p973565"/>
			<content type="html"><![CDATA[<div class="quotebox"><cite>Defenz0r wrote:</cite><blockquote><p>Make sure it will be possible to run on a Server, like Ubuntu or so. Because else, it might be harder to maintain.<br />Running it locally could be easier, but I&#039;m uncertain if thats as good.<br />Having stuff displayed in the browser is just great...</p><p>My idea is to simply sync with MEGA, fetch the data regularly with MEGAcmd on my Ubuntu Server, and having the graphs / charts refresh accordingly.</p></blockquote></div><p>I don&#039;t know what MEGA is.&nbsp; But the problem with having something on a webserver to do this is that accessing a server from your webbrowser won&#039;t be able to access the local filesystem and get the names of the all the files, which are what contain the data needed for the analysis.&nbsp; Users could have some local app that processes the filenames and gives a lump of text to upload to a server, but it&#039;s barely any harder to build a local app that does all the analysis without having a server involved.&nbsp; So I think the server might actually end up complicating things for users, not simplifying.</p>]]></content>
			<author>
				<name><![CDATA[hesitz]]></name>
				<uri>https://forum.modartt.com/profile.php?id=6474</uri>
			</author>
			<updated>2021-01-28T01:28:24Z</updated>
			<id>https://forum.modartt.com/viewtopic.php?pid=973565#p973565</id>
		</entry>
		<entry>
			<title type="html"><![CDATA[Re: Feature request Chart for Archived MIDI - see how much you've played]]></title>
			<link rel="alternate" href="https://forum.modartt.com/viewtopic.php?pid=973564#p973564"/>
			<content type="html"><![CDATA[<p>&gt;here&#039;s the script i used (perl).&nbsp; it was quick and dirty, so please no code bashing <i class="far fa-smile smiley"></i>&nbsp; (well, if you have some advice that&#039;s great.) i&#039;m on a linux box.&nbsp; there are two perl &gt;modules i used for convenience, Time::Piece and File::Finder.</p><p>I mean, that&#039;s all good, but could you parse some graphs through the Commandline/Shell, using this as template? Perl or Python might be a good basis, cause you can run it anywhere, I guess.<br /><a href="https://jsfiddle.net/Lso6nmu4/">https://jsfiddle.net/Lso6nmu4/</a></p><p>You could basically put this as HTML code, and at the point you want to use values, add them. The CSS is completely optional.<br />So you are generating a HTML file, that you can then Host on Port 80.</p><p>What do you think? <br />I mean, it could run on a webserver this way.</p>]]></content>
			<author>
				<name><![CDATA[Defenz0r]]></name>
				<uri>https://forum.modartt.com/profile.php?id=6481</uri>
			</author>
			<updated>2021-01-28T00:20:56Z</updated>
			<id>https://forum.modartt.com/viewtopic.php?pid=973564#p973564</id>
		</entry>
		<entry>
			<title type="html"><![CDATA[Re: Feature request Chart for Archived MIDI - see how much you've played]]></title>
			<link rel="alternate" href="https://forum.modartt.com/viewtopic.php?pid=973562#p973562"/>
			<content type="html"><![CDATA[<p>here&#039;s the script i used (perl).&nbsp; it was quick and dirty, so please no code bashing <i class="far fa-smile smiley"></i>&nbsp; (well, if you have some advice that&#039;s great.) i&#039;m on a linux box.&nbsp; there are two perl modules i used for convenience, Time::Piece and File::Finder.</p><p>my midi files are sitting under this in directories ./2021, ./2020, etc., with subdirectories for each month, just as PTQ stores them in the midi archive.&nbsp; in particular the months are 0-padded 2-digit strings.</p><p>the script writes to stdout and produces three columns.&nbsp; the first is day-of-year, the second the notes played on that day, and the third is the time in seconds on that day.&nbsp; i loaded the output into gnuplot to produce the graph.</p><div class="codebox"><pre><code>#!/usr/bin/perl

use Time::Piece;
use File::Finder;
use autodie;
use v5.10;

die &quot;usage: $0 year\n&quot; if @ARGV &lt; 1;

my ($year) = @ARGV;

my @midifiles = grep {/\.mid/} File::Finder-&gt;in(&quot;./$year/&quot;);

my %playingdata = ();
for my $f (@midifiles) {
  my $date = &quot;&quot;;
  my $notes = &quot;&quot;;
  my $seconds = &quot;&quot;;
  if ($f =~ m|\./$year/\d\d/([\d-]+) \d+ [()\w]+ (\d+) notes, (\d+) seconds|) {
    ($date, $notes, $seconds) = ($1, $2, $3);
  }
  my $dayofyear = Time::Piece-&gt;strptime($date, &quot;%Y-%m-%d&quot;)-&gt;yday();
  $playingdata{$dayofyear}{&quot;notes&quot;} += $notes;
  $playingdata{$dayofyear}{&quot;seconds&quot;} += $seconds;
}

for (sort {$a &lt;=&gt; $b} keys %playingdata) {
  say &quot;$_ $playingdata{$_}{&#039;notes&#039;} $playingdata{$_}{&#039;seconds&#039;}&quot;;
}</code></pre></div>]]></content>
			<author>
				<name><![CDATA[budo]]></name>
				<uri>https://forum.modartt.com/profile.php?id=5184</uri>
			</author>
			<updated>2021-01-27T22:59:55Z</updated>
			<id>https://forum.modartt.com/viewtopic.php?pid=973562#p973562</id>
		</entry>
		<entry>
			<title type="html"><![CDATA[Re: Feature request Chart for Archived MIDI - see how much you've played]]></title>
			<link rel="alternate" href="https://forum.modartt.com/viewtopic.php?pid=973555#p973555"/>
			<content type="html"><![CDATA[<p>&gt; So I&#039;ll look forward to checking out any script that&#039;s made public for this.&nbsp; Or I&#039;ll end up writing my own and offering it up here</p><p>Thanks! Might be possible I will distribute one, too.<br />But if you try, may ...</p><p>Make sure it will be possible to run on a Server, like Ubuntu or so. Because else, it might be harder to maintain.<br />Running it locally could be easier, but I&#039;m uncertain if thats as good.<br />Having stuff displayed in the browser is just great...</p><p>My idea is to simply sync with MEGA, fetch the data regularly with MEGAcmd on my Ubuntu Server, and having the graphs / charts refresh accordingly.</p><p>What might be inspiring are those graphs <a href="https://cultris.net/">https://cultris.net/</a><br />But the solution should not load so long (laughs)</p>]]></content>
			<author>
				<name><![CDATA[Defenz0r]]></name>
				<uri>https://forum.modartt.com/profile.php?id=6481</uri>
			</author>
			<updated>2021-01-27T17:48:27Z</updated>
			<id>https://forum.modartt.com/viewtopic.php?pid=973555#p973555</id>
		</entry>
		<entry>
			<title type="html"><![CDATA[Re: Feature request Chart for Archived MIDI - see how much you've played]]></title>
			<link rel="alternate" href="https://forum.modartt.com/viewtopic.php?pid=973551#p973551"/>
			<content type="html"><![CDATA[<div class="quotebox"><cite>thiesdewaard wrote:</cite><blockquote><p>Fun idea, but i&#039;m not entirely sure there would be a huge fan base for it in this community - and therefor it might not end up very high on the Modartt priority to-do list...</p><div class="quotebox"><cite>budo wrote:</cite><blockquote><p>not sure how illuminating it is</p></blockquote></div><p>That would be my worry too - to me (personally) it would be akin to tracking everything trackable on your road bike for a day or two (just because it&#039;s possible), publish it proudly to all friends on facebook and then loose interest for lack of further purpose (other then fun).</p></blockquote></div><p>Information regarding exercise efforts can be extremely important for building and maintaining a habit.&nbsp; The website Strava.com has built a valuable business off of this, giving runners and cyclists a place to upload data (collected on gps watches or cycling computers) regarding every run or ride they do.&nbsp; Having this record is really helpful for all sorts of reasons: there&#039;s no uncertainty regarding what you&#039;ve done in the past, you can motivate yourself (&quot;I&#039;m going to try to do more than last week), there&#039;s an incentive to keep streaks going (&quot;I&#039;ve run every day for the last two weeks and I want to keep that streak going&quot;), and more.&nbsp; Way more.</p><p>Yes, something like Strava makes it public and has a social media aspect.&nbsp; But that&#039;s not necessary at all, and many people use it despite not liking the social aspects Strava.&nbsp; (There are of course ways to do this entirely in private, using other apps, but many people find that Strava&#039;s public nature helps them keep getting out there for regular running and cycling; not a bad thing in my opinion.)</p><p>Anyway, I&#039;ve tried several times to clock and record all my piano practice time.&nbsp; &nbsp;I&#039;d like to know it.&nbsp; I think knowing that would be helpful.&nbsp; But every time I&#039;ve tried I&#039;ve failed.&nbsp; Never was able to develop the habit of logging all my time.</p><p>I&#039;d never thought about it before, but that archived group of midi files in Pianoteq is actually a good source of info to create a record that gives a pretty good indication of how much you&#039;ve practiced.&nbsp; It doesn&#039;t exactly indicate the time spent sitting at a piano keyboard.&nbsp; But it would not be far off for me. And it&#039;s quite easy to process that list of files in a Python script (or some other scripting language) to convert the list of filenames into a useful form, both textual and graphic.&nbsp; Whether it&#039;s in Python or some other language, there are ways to make it easy to execute that script on a Mac, Windows, or Linux PC.</p><p>So I&#039;ll look forward to checking out any script that&#039;s made public for this.&nbsp; Or I&#039;ll end up writing my own and offering it up here.</p>]]></content>
			<author>
				<name><![CDATA[hesitz]]></name>
				<uri>https://forum.modartt.com/profile.php?id=6474</uri>
			</author>
			<updated>2021-01-27T17:15:10Z</updated>
			<id>https://forum.modartt.com/viewtopic.php?pid=973551#p973551</id>
		</entry>
		<entry>
			<title type="html"><![CDATA[Re: Feature request Chart for Archived MIDI - see how much you've played]]></title>
			<link rel="alternate" href="https://forum.modartt.com/viewtopic.php?pid=973549#p973549"/>
			<content type="html"><![CDATA[<div class="quotebox"><cite>budo wrote:</cite><blockquote><p>thanks, i see how to do it now (what i was missing was that the image had to be hosted somewhere online ... there doesn&#039;t seem to be a way to upload local files). </p><p>this is what i got from analyzing 2020 (and adding up the total notes and time played per day)</p><br /><p><a href="https://imgbox.com/1R5hd7mB"><span class="postimg"><img src="https://thumbs2.imgbox.com/ed/b4/1R5hd7mB_t.png" alt="https://thumbs2.imgbox.com/ed/b4/1R5hd7mB_t.png" title="https://thumbs2.imgbox.com/ed/b4/1R5hd7mB_t.png"/></span></a></p></blockquote></div><p>Can you share the script? I&#039;m wanting to work on it and put it on my server.</p><p>Cause I might be too long busy in doing it myself, I might pay someone for quick &amp; dirty work. Want to get it done so it works with <a href="https://www.chartjs.org/">https://www.chartjs.org/</a></p><p>Thinking more of a month/day basis. Like a calender. But that is to be decided yet.</p>]]></content>
			<author>
				<name><![CDATA[Defenz0r]]></name>
				<uri>https://forum.modartt.com/profile.php?id=6481</uri>
			</author>
			<updated>2021-01-27T16:30:40Z</updated>
			<id>https://forum.modartt.com/viewtopic.php?pid=973549#p973549</id>
		</entry>
		<entry>
			<title type="html"><![CDATA[Re: Feature request Chart for Archived MIDI - see how much you've played]]></title>
			<link rel="alternate" href="https://forum.modartt.com/viewtopic.php?pid=973548#p973548"/>
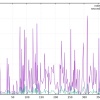
			<content type="html"><![CDATA[<p>thanks, i see how to do it now (what i was missing was that the image had to be hosted somewhere online ... there doesn&#039;t seem to be a way to upload local files). </p><p>this is what i got from analyzing 2020 (and adding up the total notes and time played per day)</p><br /><p><a href="https://imgbox.com/1R5hd7mB"><span class="postimg"><img src="https://thumbs2.imgbox.com/ed/b4/1R5hd7mB_t.png" alt="https://thumbs2.imgbox.com/ed/b4/1R5hd7mB_t.png" title="https://thumbs2.imgbox.com/ed/b4/1R5hd7mB_t.png"/></span></a></p>]]></content>
			<author>
				<name><![CDATA[budo]]></name>
				<uri>https://forum.modartt.com/profile.php?id=5184</uri>
			</author>
			<updated>2021-01-27T16:01:25Z</updated>
			<id>https://forum.modartt.com/viewtopic.php?pid=973548#p973548</id>
		</entry>
		<entry>
			<title type="html"><![CDATA[Re: Feature request Chart for Archived MIDI - see how much you've played]]></title>
			<link rel="alternate" href="https://forum.modartt.com/viewtopic.php?pid=973544#p973544"/>
			<content type="html"><![CDATA[<div class="quotebox"><cite>dcardenosa wrote:</cite><blockquote><p>I have a quick and dirty solution in my raspi4 to know how much and how fast I play every day:</p><p>Just paste this code (works for pianoteq on linux)</p><div class="codebox"><pre><code>find $HOME/.local/share/Modartt/Pianoteq/Archive -name &quot;*.mid&quot; | awk &#039;{notes[$1] += $4; seconds[$1] += $6} END{for (i in notes) print i, notes[i]&quot; notes&quot; , seconds[i]/60&quot; minutes&quot;, notes[i]/seconds[i]&quot; nps&quot;}&#039; | awk -F&quot;/&quot; &#039;{print $11}&#039; | sort</code></pre></div><p>Some day I sould do something more refined in python <i class="far fa-laugh smiley"></i> .....</p></blockquote></div><br /><p>How todo that on macOS? I&#039;ve only made it for a month each (2021-1) with CyberChef and LibreOffice.<br />I&#039;ve used RegEx</p><p>You may use: BBCode Images Smilies -&gt; I used BBCode for images here.</p><p><span class="postimg"><img src="https://i.imgur.com/UbjDKNf.png" alt="https://i.imgur.com/UbjDKNf.png" title="https://i.imgur.com/UbjDKNf.png"/></span></p>]]></content>
			<author>
				<name><![CDATA[Defenz0r]]></name>
				<uri>https://forum.modartt.com/profile.php?id=6481</uri>
			</author>
			<updated>2021-01-27T13:42:30Z</updated>
			<id>https://forum.modartt.com/viewtopic.php?pid=973544#p973544</id>
		</entry>
		<entry>
			<title type="html"><![CDATA[Re: Feature request Chart for Archived MIDI - see how much you've played]]></title>
			<link rel="alternate" href="https://forum.modartt.com/viewtopic.php?pid=973531#p973531"/>
			<content type="html"><![CDATA[<div class="quotebox"><blockquote><p>Push</p></blockquote></div><p>i&#039;d be happy to share the image, i just don&#039;t see how to do it in the forum ...</p><p>maybe someone could explain how to upload an image?</p>]]></content>
			<author>
				<name><![CDATA[budo]]></name>
				<uri>https://forum.modartt.com/profile.php?id=5184</uri>
			</author>
			<updated>2021-01-26T19:47:26Z</updated>
			<id>https://forum.modartt.com/viewtopic.php?pid=973531#p973531</id>
		</entry>
</feed>